Heme : Metabolism Pathway
Heme Metabolism: Biosynthesis
Heme is a vital molecule. It acts as a "prosthetic group" (a permanent helper) for proteins like Hemoglobin (oxygen transport), Myoglobin (oxygen storage), and Cytochromes (drug detoxification and electron transport).
1. Structure & Definitions
What is a Porphyrin?
Porphyrins are large, cyclic compounds made of 4 Pyrrole Rings linked together by methenyl bridges.
They are famous for binding metal ions.
Example: Magnesium in Chlorophyll (plants).
Example: Iron in Heme (humans).
The Side Chains
The properties of the porphyrin depend on which "decorations" (side chains) are attached to the rings:
- A: Acetate (Acetyl)
- P: Propionate (Propionyl)
- M: Methyl
- V: Vinyl
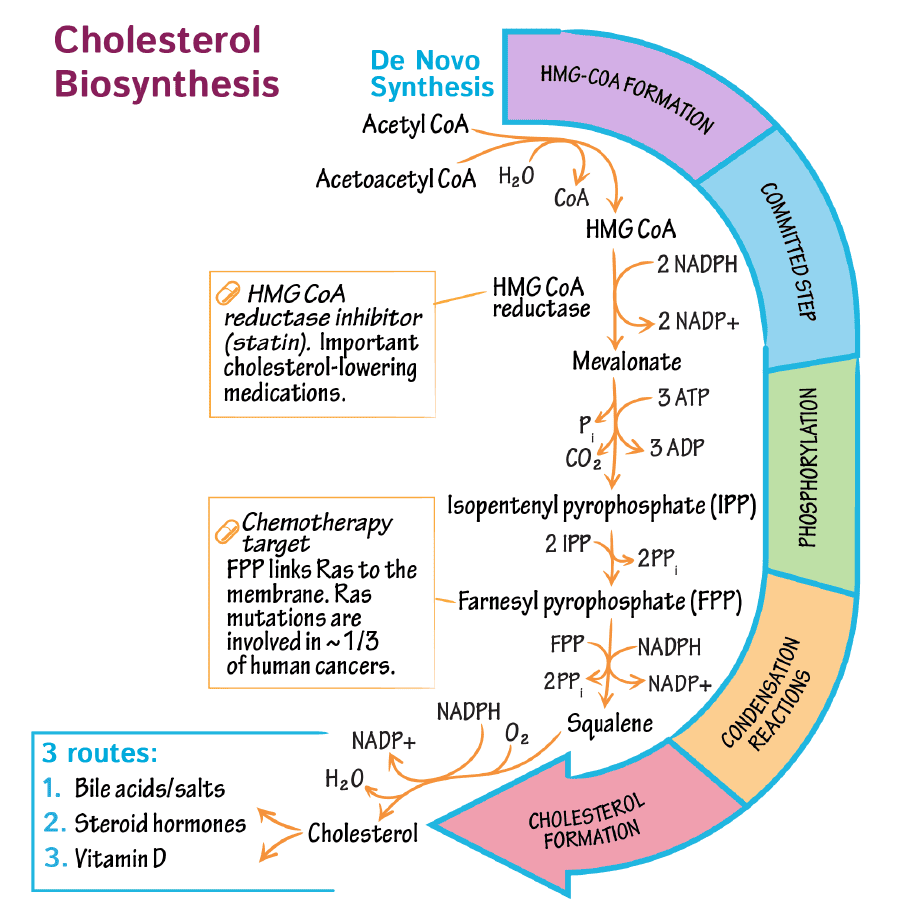
2. Steps of Heme Synthesis
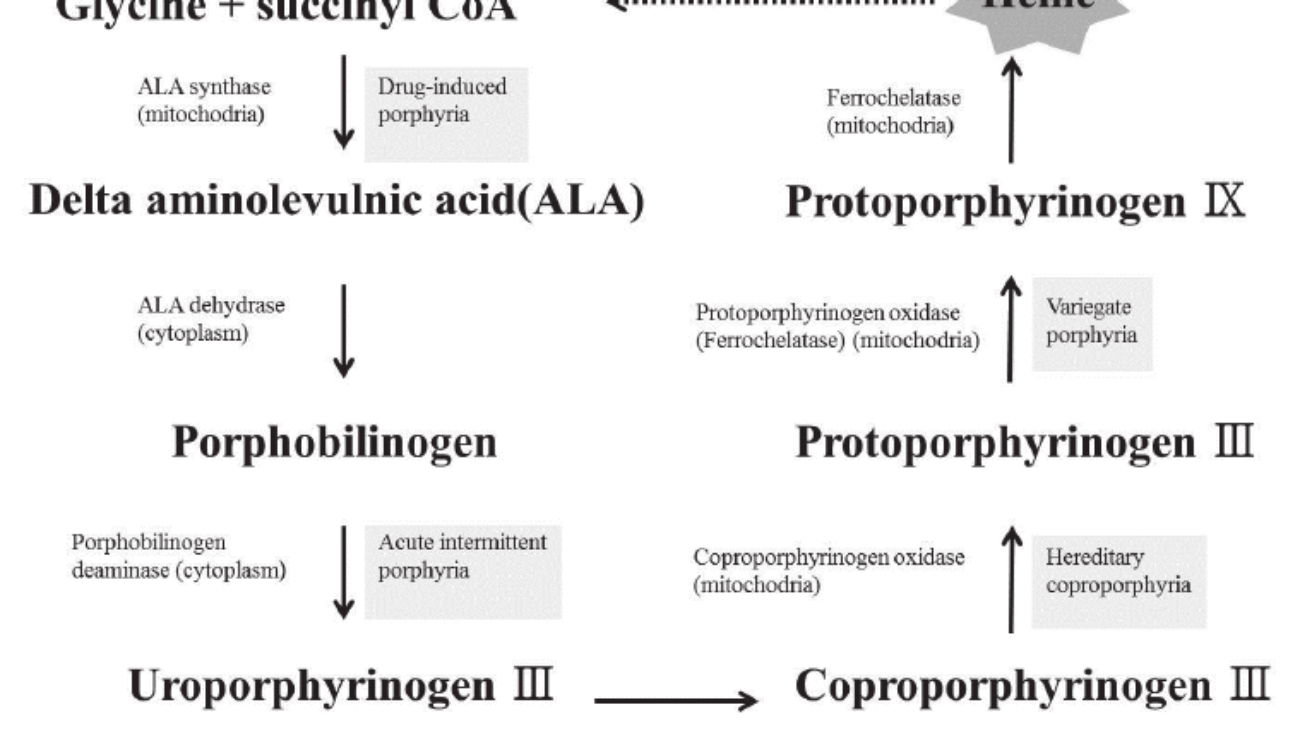
This process is like a relay race. It starts in the Mitochondria, runs out to the Cytosol, and finishes back in the Mitochondria.
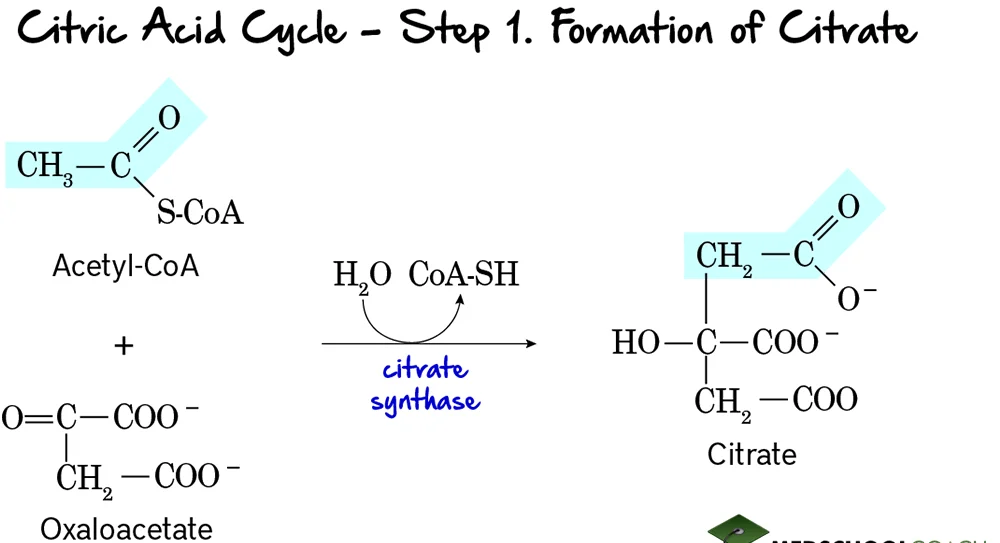
Step 1: Formation of ALA (The Rate-Limiting Step)
The Reaction:
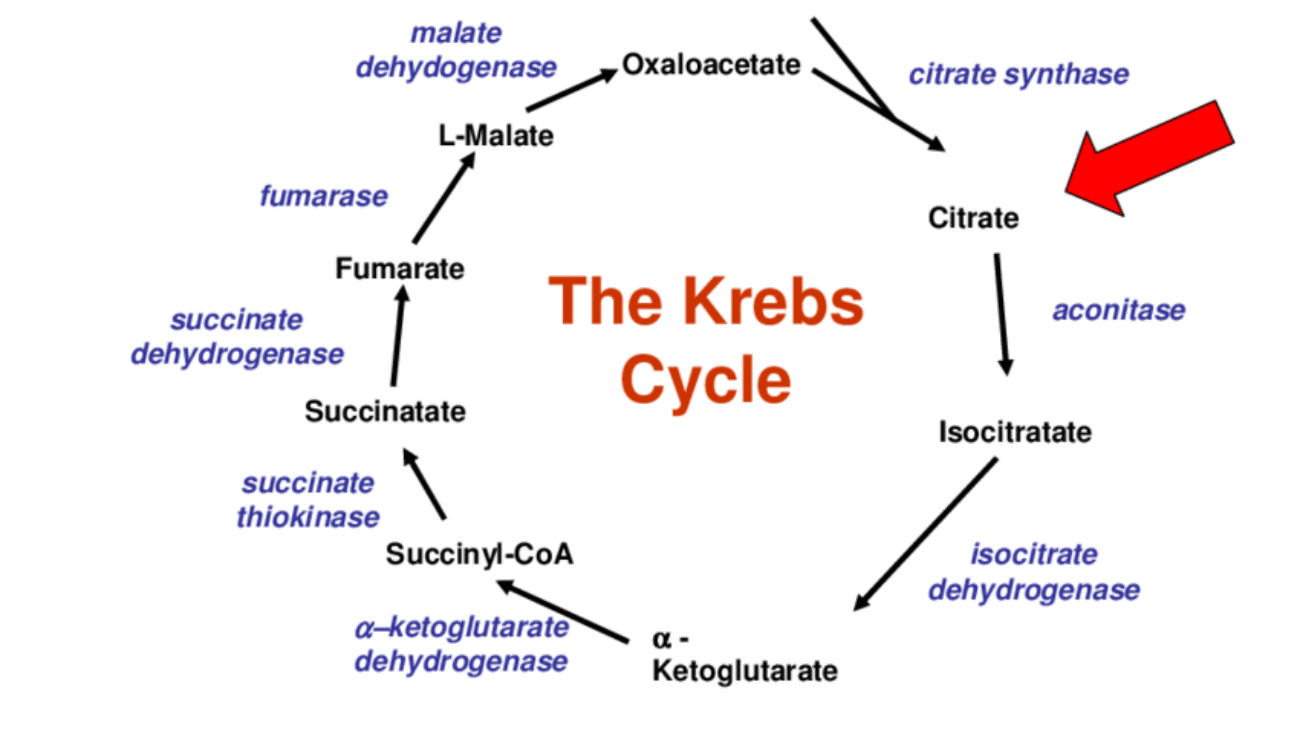
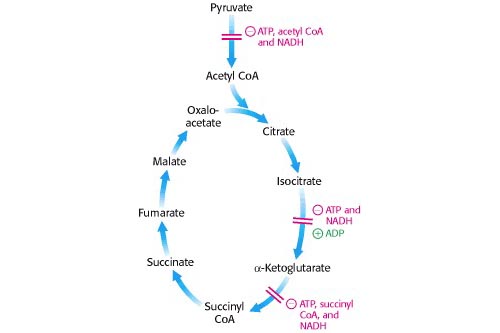
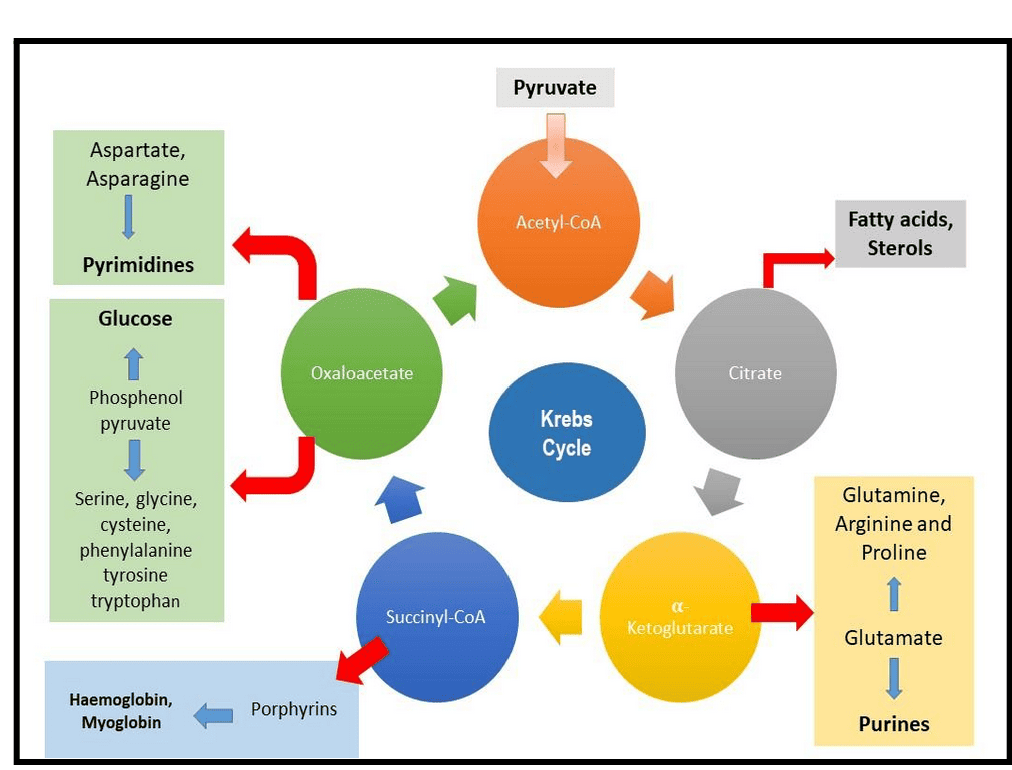
Succinyl CoA (from TCA cycle) + Glycine → δ-Aminolevulinate (ALA) + CO₂
- Enzyme: ALA Synthase (ALAS).
- Coenzyme Required: Pyridoxal Phosphate (Vitamin B6).
- Significance: This is the Committed Step. Once this happens, the cell is committed to making Heme.
- ALAS-1: Found in the Liver (and all tissues).
- ALAS-2: Found in Bone Marrow (Erythroid cells).
Clinical Note: Mutation in ALAS-2 causes X-Linked Sideroblastic Anemia (Iron cannot be used, so it piles up).
Steps 2 to 5: Building the Ring in the Cytosol
Step 2: Formation of Porphobilinogen (PBG)
2 molecules of ALA condense to form 1 Ring (PBG).
- Enzyme: ALA Dehydratase (also called PBG Synthase).
- Requirement: This enzyme contains Zinc.
Result: ALA accumulates (Neurotoxic) causing brain damage and anemia.
Step 3: Formation of Hydroxymethylbilane (HMB)
4 molecules of PBG are linked together in a line (Linear Tetrapyrrole).
- Enzyme: HMB Synthase (PBG Deaminase).
Step 4: Ring Closure (Uroporphyrinogen III)
The linear chain is curled into a circle.
- Enzyme: Uroporphyrinogen III Synthase.
- Mechanism: It flips one of the rings to create an asymmetric "Type III" structure.
- Note: If this enzyme is missing, the ring closes spontaneously but incorrectly (Type I), which is useless to the body.
Step 5: Decarboxylation
Uroporphyrinogen III → Coproporphyrinogen III
- Enzyme: Uroporphyrinogen Decarboxylase.
- Action: Removes Carboxyl groups (CO₂). This makes the molecule less water-soluble (more hydrophobic) so it can re-enter the mitochondria.
Steps 6 to 9: The Final Touches
-
Step 6 & 7: Oxidation
Coproporphyrinogen III enters the mitochondria. It is oxidized to Protoporphyrinogen IX and then to Protoporphyrin IX.
Enzymes: Coproporphyrinogen Oxidase & Protoporphyrinogen Oxidase.
Key Detail: Step 8 creates double bonds, giving the molecule its red color. -
Step 9: Insertion of Iron (The Finale)
Protoporphyrin IX + Fe²⁺ (Ferrous) → HEME
- Enzyme: Ferrochelatase (Heme Synthase).
- Inhibitor: This enzyme is ALSO sensitive to Lead. Lead poisoning blocks the final insertion of iron.
3. Regulation of Heme Synthesis
The body carefully controls the first enzyme, ALA Synthase, to prevent overproduction.
Heme (the product) acts as a negative regulator.
- Repression: Heme stops the gene from making more ALA Synthase.
- Allosteric Inhibition: Hematin (Heme with Fe³⁺) binds directly to the enzyme to stop it.
Drugs like Barbiturates (sedatives) increase Heme synthesis.
- Barbiturates are metabolized by Cytochrome P450 in the liver.
- Cytochrome P450 contains Heme.
- Metabolizing the drug consumes the Heme.
- Free Heme levels drop.
- The "Brake" (Feedback Inhibition) is removed.
- ALA Synthase increases to replenish the lost Heme.
High concentrations of Glucose inhibit the induction of ALA Synthase.
Clinical Relevance: Giving glucose (IV sugar) is part of the treatment for acute attacks of Porphyria to try and slow down the pathway.
This is a Tuberculosis drug. It depletes Pyridoxal Phosphate (Vitamin B6).
Since Step 1 requires B6, INH can stop Heme synthesis and cause anemia.
Regulation of Heme Synthesis
The body must maintain a perfect balance of Heme.
Too Little: You get Anemia (no oxygen transport).
Too Much: Heme and its precursors are toxic to cells.
The main control switch is the very first enzyme: ALA Synthase (ALAS).
A. The Tale of Two Enzymes (ALAS1 vs. ALAS2)
Even though they do the same job, there are two different versions of this enzyme depending on where they live.
1. ALAS1 (The Housekeeper)
- Location: Found in All Tissues (Liver, etc.).
- Purpose: Makes heme for "Housekeeping" proteins like Cytochromes and Catalase.
- Regulation: Controlled by the amount of Heme present.
2. ALAS2 (The Specialist)
- Location: Found ONLY in Erythroid Cells (Red Blood Cell precursors in Bone Marrow).
- Purpose: Makes massive amounts of heme specifically for Hemoglobin.
- Regulation: Controlled by the amount of Iron present.
B. Regulation of ALAS1 (Liver)
The liver uses Negative Feedback Inhibition. Heme acts as the "Stop" signal. It attacks the enzyme at three different levels to shut it down.
What happens: High levels of "Free Heme" (heme not attached to proteins) travel to the nucleus.
The Effect: It tells the DNA to stop making the mRNA for ALAS1. This is the most important mechanism.
What happens: Heme makes the ALAS1 mRNA unstable.
The Effect: The mRNA is chopped up (degraded) before it can be used to build the enzyme.
Recall: ALAS1 is made in the Cytosol but must work in the Mitochondria.
The Effect: Heme blocks the door. It prevents the enzyme from entering the mitochondria. If it can't get in, it can't work.
C. Regulation of ALAS2 (Erythroid Cells)
Red blood cells don't care about free heme levels as much. They care about IRON. You cannot make Hemoglobin without Iron.
The IRE / IRP System
This acts like a physical switch on the mRNA.
- The Setup: The mRNA for ALAS2 has a special loop structure at the beginning (5' end) called the Iron-Responsive Element (IRE).
- Scenario A: Low Iron (Don't Build)
- A protein called IRP (Iron Regulatory Protein) sits on the loop (IRE).
- This acts like a roadblock. The ribosome cannot read the mRNA.
- Result: No ALAS2 is made. No Heme is made.
- Scenario B: High Iron (Build!)
- Iron binds to the IRP protein.
- This causes the IRP to fall off the mRNA.
- The roadblock is removed! Translation proceeds.
- Result: ALAS2 is made. Heme is produced to match the iron supply.
D. Other Factors Influencing Synthesis
Besides Heme and Iron, outside factors can speed up or slow down the process.
Mechanism: These drugs are metabolized by Cytochrome P450 (a heme protein).
The liver burns up its Heme supply to fight the drug. Low heme levels release the "brake" on ALAS1.
Result: Massive increase in Heme synthesis.
Mechanism: High glucose levels have a "calming" effect on ALAS1 (represses activity).
Clinical Use: We give IV Glucose (sugar) to patients having a Porphyria attack to stop the overproduction of toxic precursors.
Mechanism: Steroids (Estrogen, Androgens) induce ALAS1 synthesis.
This is why Porphyria attacks often happen during puberty or specific phases of the menstrual cycle.
Heme Degradation: The Disposal System
Making Heme is important, but getting rid of old Heme safely is just as critical. This process happens mainly in the Reticuloendothelial System (RES), specifically in the Spleen and Liver.
Phase 1: Breaking the Ring (Spleen)
- Globin (Protein): Broken down into Amino Acids and recycled.
- Iron (Fe): Removed and stored/recycled.
- Porphyrin Ring: This cannot be recycled. It must be degraded.
Step 1: Heme → Biliverdin (The Green Step)
- Substrate: Heme. (Note: The Iron must be oxidized from Fe²⁺ to Fe³⁺ first).
- Enzyme: Heme Oxygenase (HO).
- Action: It cuts the Porphyrin ring open at a specific bridge.
- The Products:
- Biliverdin: A linear tetrapyrrole with a GREEN color.
- Iron (Fe³⁺): Released for recycling.
- Carbon Monoxide (CO): This is the only time the body makes CO naturally. It acts as a signaling molecule.
- Significance: This is the Rate-Limiting Step of degradation.
Step 2: Biliverdin → Bilirubin (The Yellow Step)
- Substrate: Biliverdin (Green).
- Enzyme: Biliverdin Reductase.
- Requirement: Uses NADPH.
- Product: Bilirubin. This pigment is YELLOW-ORANGE.
Phase 2: Transport in the Blood
Step 3: The Albumin Taxi
The Bilirubin made in the spleen is called Unconjugated Bilirubin (UCB) or "Indirect Bilirubin."
UCB is Hydrophobic (Fat-soluble). It hates water. It cannot swim in the blood alone.
It binds tightly to Albumin (a protein in blood). Albumin acts as a "Taxi" to carry it to the liver.
Because Unconjugated Bilirubin is fat-soluble, if there is too much of it (and not enough Albumin), it can cross cell membranes. In babies, it can cross the Blood-Brain Barrier and deposit in the brain, causing permanent brain damage (Kernicterus).
Phase 3: Processing in the Liver
Step 4: Uptake
- The Albumin taxi drops Bilirubin off at the liver cell (hepatocyte).
- Carrier proteins (OATP) bring it inside.
- Ligandin: Inside the cell, it binds to Ligandin (or GST-B) so it doesn't slip back out.
Step 5: Conjugation (Making it Water-Soluble)
We need to make the bilirubin safe to excrete.
- Enzyme: UDP-glucuronosyltransferase (UGT1A1).
- Action: It attaches Glucuronic Acid molecules to the bilirubin.
- Product: Conjugated Bilirubin (Direct Bilirubin).
- Result: It is now Hydrophilic (Water-soluble). It can be mixed into bile.
Step 6: Secretion into Bile
- Transporter: MRP2 (Multidrug resistance-associated protein 2).
- Action: It pumps Conjugated Bilirubin against the gradient into the bile ducts.
- Significance: This is the Rate-Limiting Step for excretion. If this pump fails, Conjugated Bilirubin backs up into the blood.
Phase 4: The Intestine & Final Colors
Bile carries the Conjugated Bilirubin into the Intestine. Here, bacteria take over.
Gut bacteria remove the glucuronic acid (deconjugation) and convert bilirubin into Urobilinogen (Colorless).
Bacteria oxidize Urobilinogen into Stercobilin.
Color: BROWN
(This is why poop is brown).
Some is reabsorbed, goes to the kidney, and becomes Urobilin.
Color: YELLOW
(This is why pee is yellow).
Some is reabsorbed and goes back to the liver.
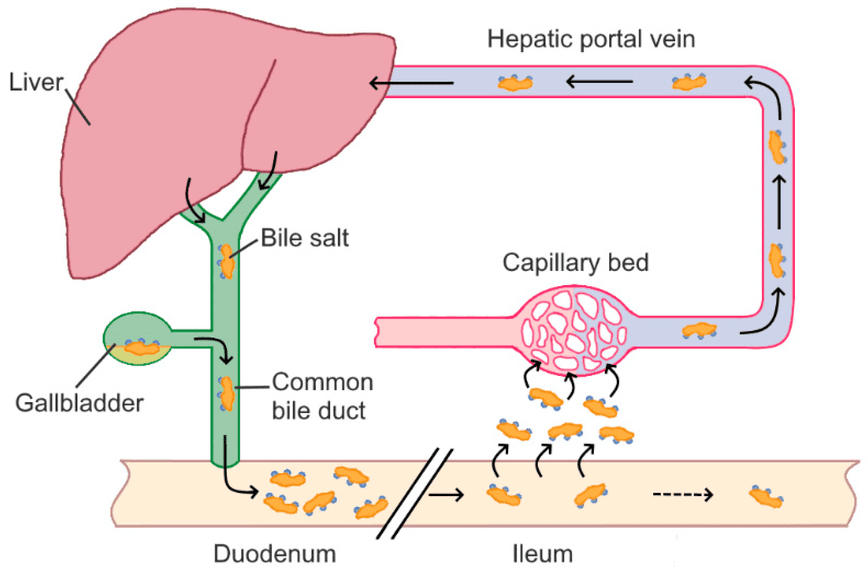
Enterohepatic Circulation
Visual Summary of Colors
Clinical Aspects: When Heme Metabolism Fails
We have learned how Heme is built and destroyed. Now we look at the diseases that happen when these processes break. We divide them into two main categories:
Defects in Synthesis.
Problem: Toxic precursors build up.
Defects in Degradation.
Problem: Bilirubin builds up.
Porphyrias: Disorders of Heme Synthesis
These are usually genetic (inherited). Depending on which enzyme is broken, different toxic chemicals accumulate. We classify them by their main symptoms: Nerve Pain (Acute) or Skin Blisters (Cutaneous).
1. Acute Intermittent Porphyria (AIP)
The "Nervous System" Porphyria
- Enzyme Defect: PBG Deaminase (Step 3).
- Accumulation: ALA and PBG.
- Symptoms (The 5 P's):
- Painful Abdomen (Severe, often confused for surgery).
- Polyneuropathy (Weakness, paralysis).
- Psychiatric (Anxiety, hallucinations).
- Port-wine Urine (Reddish-brown urine when standing).
- Precipitated by Drugs.
- Important: NO Skin Photosensitivity.
Triggers: Things that speed up Heme synthesis (Induce Cyt P450): Barbiturates, Alcohol, Sulfa drugs, Fasting/Dieting.
Treatment:
1. Stop the drug/alcohol.
2. IV Glucose (Sugar) or Hemin. (These inhibit ALAS1 to stop the production line).
2. Porphyria Cutanea Tarda (PCT)
The "Skin" Porphyria (Most Common)
- Enzyme Defect: Uroporphyrinogen Decarboxylase (Step 5).
- Accumulation: Uroporphyrinogen.
- Symptoms:
- Photosensitivity: The skin reacts to sunlight.
- Blisters: Fluid-filled bullae on hands/face.
- Hypertrichosis: Excessive hair growth.
- Tea-Colored Urine.
Triggered by: Chronic Alcoholism, Iron Overload, Hepatitis C.
Treatment:
1. Avoid Alcohol/Sun.
2. Phlebotomy: Drawing blood to reduce Iron levels.
3. Congenital Erythropoietic Porphyria (CEP)
Also known as Günther's Disease. This is extremely severe and rare.
- Defect: Uroporphyrinogen III Synthase.
- Symptoms: Severe mutilating skin blisters, Erythrodontia (Red/Brown teeth that glow under UV light), red urine.
- Treatment: Bone marrow transplant.
Jaundice: Disorders of Heme Degradation
Jaundice (Hyperbilirubinemia) is the yellowing of skin and eyes (sclera) when Bilirubin blood levels exceed 2–3 mg/dL. We classify it by where the traffic jam is.
| Type | The Problem | Bilirubin Type | Urine & Stool |
|---|---|---|---|
| 1. Pre-Hepatic (Hemolytic) |
Too much breakdown.
Hemolysis (Sickle cell, Malaria) produces bilirubin faster than the liver can handle. |
High Unconjugated (Indirect). |
Urine: Normal color (Unconjugated cannot enter urine).
Stool: Normal/Dark. |
| 2. Hepatic (Hepatocellular) |
Broken Factory.
Liver cells are damaged (Hepatitis, Alcohol) and cannot conjugate or excrete. |
High Mixed (Both).
Also high Liver Enzymes (ALT/AST). |
Urine: Dark (Conjugated leaks out).
Stool: Normal or Pale. |
| 3. Post-Hepatic (Obstructive) |
Blocked Pipe.
Gallstones or Cancer block the bile duct. Bile cannot leave. |
High Conjugated (Direct).
Also high ALP & GGT. |
Urine: Very Dark/Tea-colored (Bilirubinuria).
Stool: Pale/Clay (No stercobilin). Other: Pruritus (Itching). |
Genetic Disorders of Bilirubin
-
Gilbert's Syndrome:
Severity: Mild, Benign. Very common.
Cause: Enzyme works at 30% speed.
Trigger: Stress, Fasting. -
Crigler-Najjar Syndrome:
Severity: Severe/Fatal.
Cause: Enzyme is totally missing (Type I) or very low (Type II).
Risk: Kernicterus in babies.
-
Dubin-Johnson Syndrome:
Defect: MRP2 Transporter is broken. Liver can't pump bile out.
Sign: Black Liver (Pigment accumulation). Benign. -
Rotor Syndrome:
Defect: Similar to Dubin-Johnson but milder.
Sign: No black liver.
C. Neonatal Jaundice (Physiological)
Common in newborns (60%). Their liver machinery is immature.
- Fetal RBCs die quickly (Hemolysis).
- Liver UGT1A1 enzyme is slow (Immature).
- Gut flora is low (reabsorption increases).
Unconjugated Bilirubin is fat-soluble. It crosses the thin blood-brain barrier of the baby and deposits in the brain, causing permanent damage.
💡 Cure: PhototherapyBlue light converts bilirubin into a water-soluble shape (isomer) so the baby can pee it out without needing the liver.
Biochemistry: Heme Metabolism
Test your knowledge with these 40 questions.
Heme Metabolism Quiz
Question 1/40
Quiz Complete!
Here are your results, .
Your Score
38/40
95%